Military Subject Matter Expert (MSME)
An educational and information site on how to use the sun in determining earths shape and 5D Reality.
An educational and information site on how to use the sun in determining earths shape and 5D Reality.

Corey's event form 1 is shown above. If you'd like Corey to speak at your event, gathering or as guest speaker contact Corey for details. An event speaker fee to have Corey as a guest speaker is now required. Email Corey through this website or @Coreyifish@gmail.com

Corey speaks on a wide range of topics from flat earth, giants, using the sun, the 45 degree sector test, orbital mechanics 101, timing, Operation Resolute Time, Operation North American Sun, the shift from 3D to 5D reality and consciousness.

One of the most comprehensive books ever written on using the sun to determine earths true surface shape. Its orbital mechanics 101. Teaches timing, use of the sun, military science, the 45degree sector test, the MARX device positioning method, and 133 experiment results from both sides of the terrestrial earth. Available through Xlibris.com, Amazon, Walmart and Everland media.
In 2020 Corey Kell
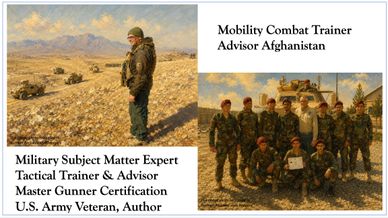
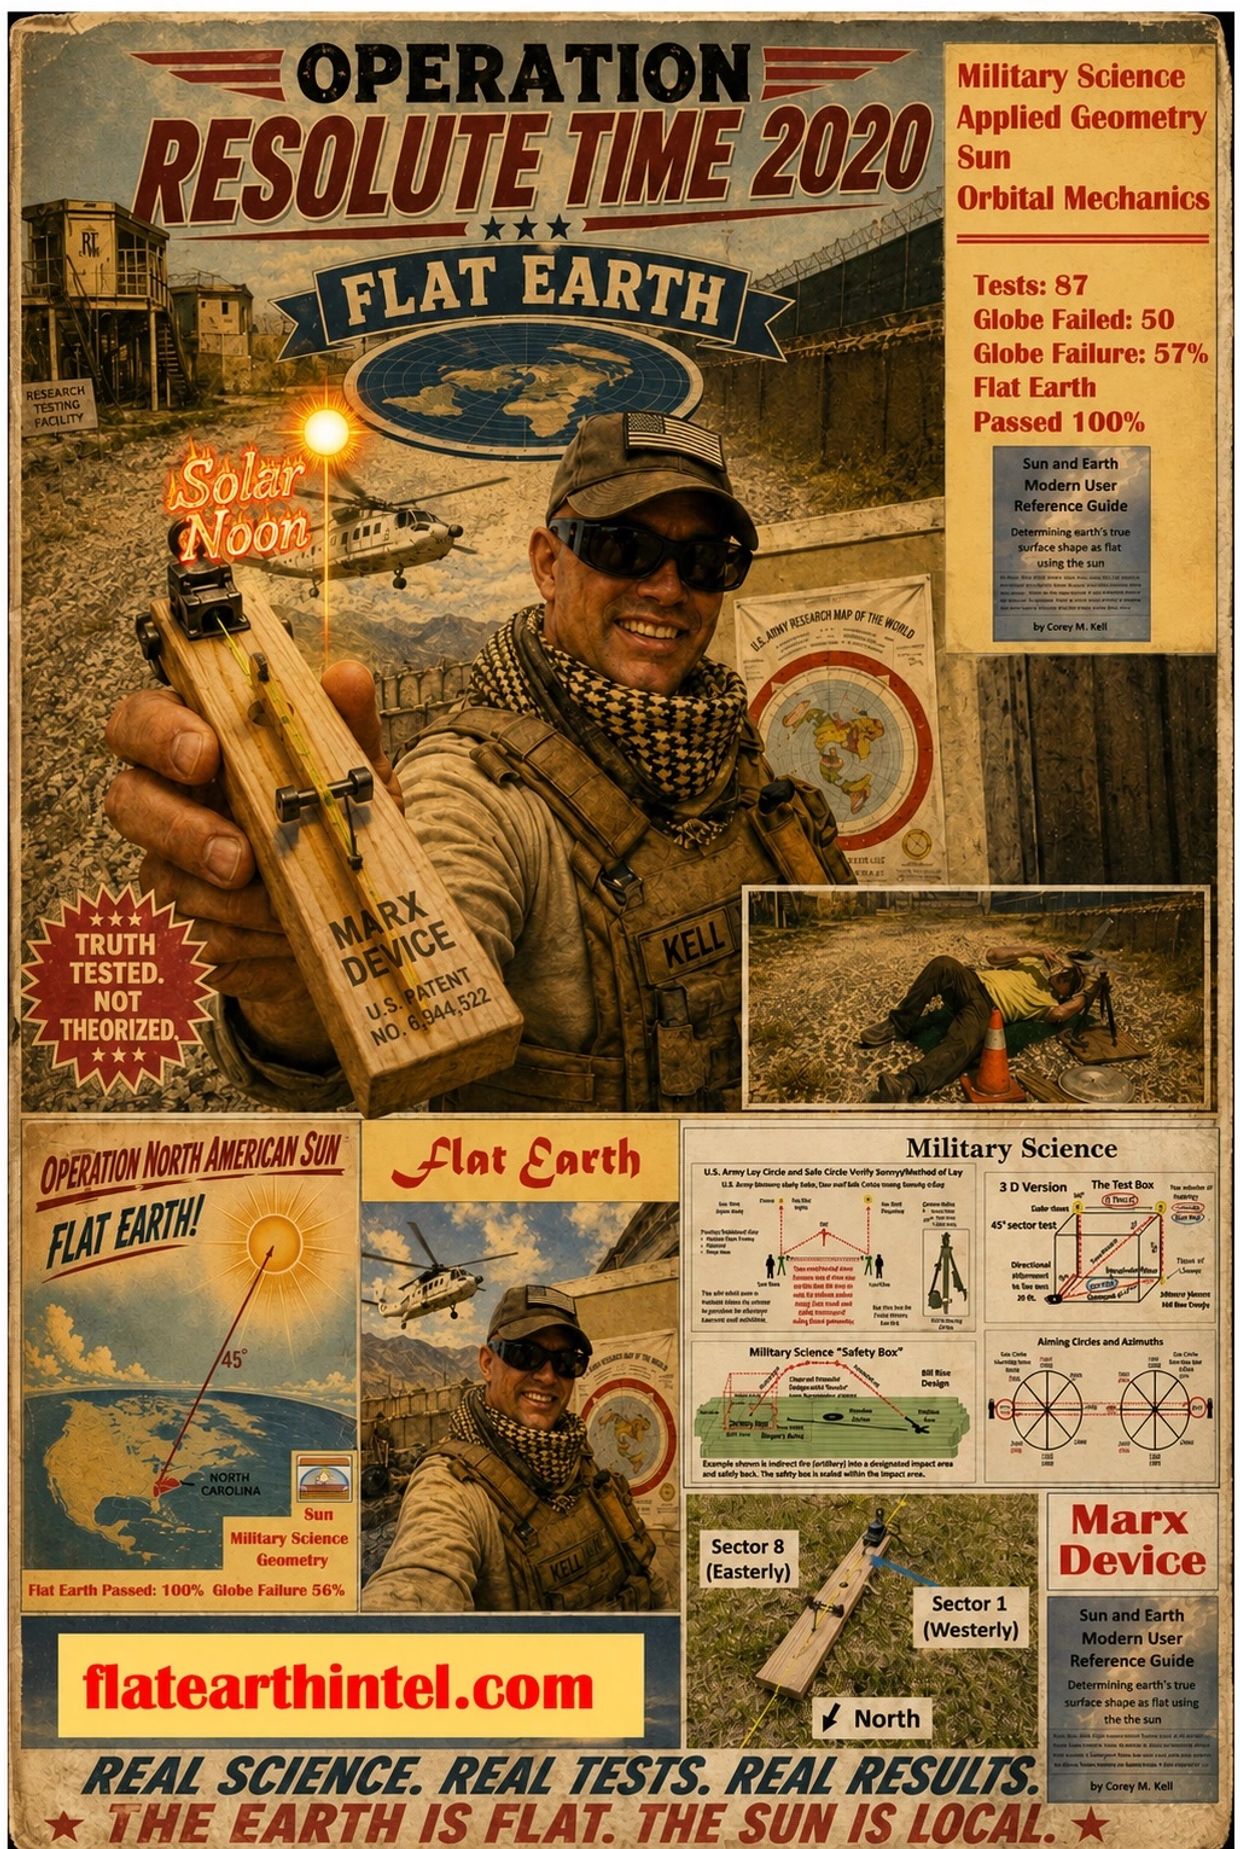
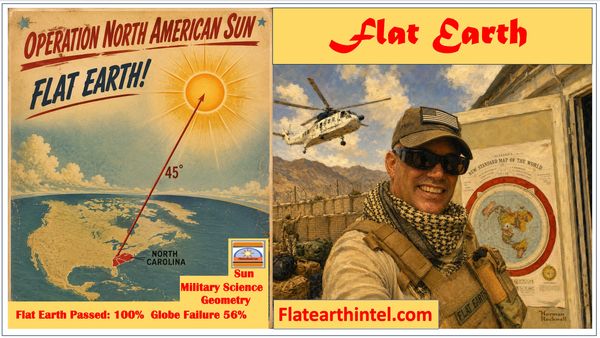
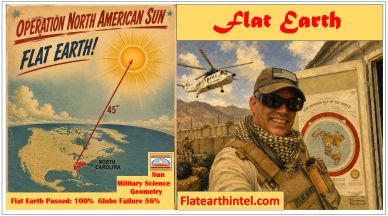
conducted extensive testing (the 45 degree sector test) of earth’s surface shape on the eastern edge of Kabul, Afghanistan at Camp Scorpion FOB. Image shows Corey measuring vertical angle the suns height at high altitude. First time in recorded history this type of testing has ever been conducted in the war zone and at high altitude. The results provided conclusive evidence the earth is flat.

Corey Kell has served as a trainer advisor in teaching tactics, weapons and equipment in the defense contract industry. Trained foreign military's as well as given congressional briefings. The quiet unseen professionals.
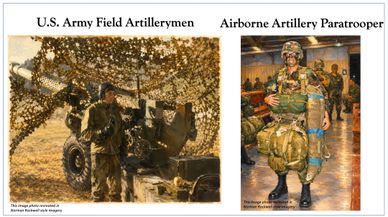
As a military subject mater expert Corey's background and military occupational specialty was field artillery weapons systems and gunnery. Earned master gunner certification through 18th FA BDE Airborne, Ft. Bragg, North Carolina.
Corey's background includes technical writing in creating POI's Program of Instructions as well as Standard Operating Procedures SOPs for weapons life fire and maneuver ranges used by military's. Additionally creating one of the largest digital libraries for training, live fire and maneuver for the Udari Range Complex in Kuwait.
Its what should have taken place in mainstream science but didn't. Verifying earths true surface shape using applied geometry vertical angle, right triangles and applying the models geometric shape. A step by step methodology in teaching correct orbital mechanics using the sun. Instead we got sticks and shadows "epic failure" of science.
Learn the higher knowledge to get to the truth and the path to enlightenment.
Its what right looks like backed up by real world science, and because lives depend on it being accurate every day.

Corey has been a guest speaker at several conferences as well as setting up displays for these events, and interacting with attendees.
The objective has always been the higher knowledge to the collective. Teaching the higher knowledge.
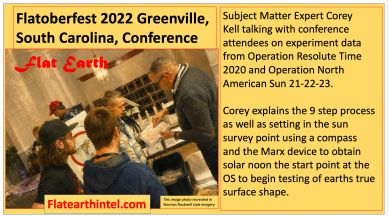
Corey interacting with conference attendees in Greenville, South Carolina at his display setup.

As the advancement of AI starts you'll notice some changes occurring on the website and how information is presented.
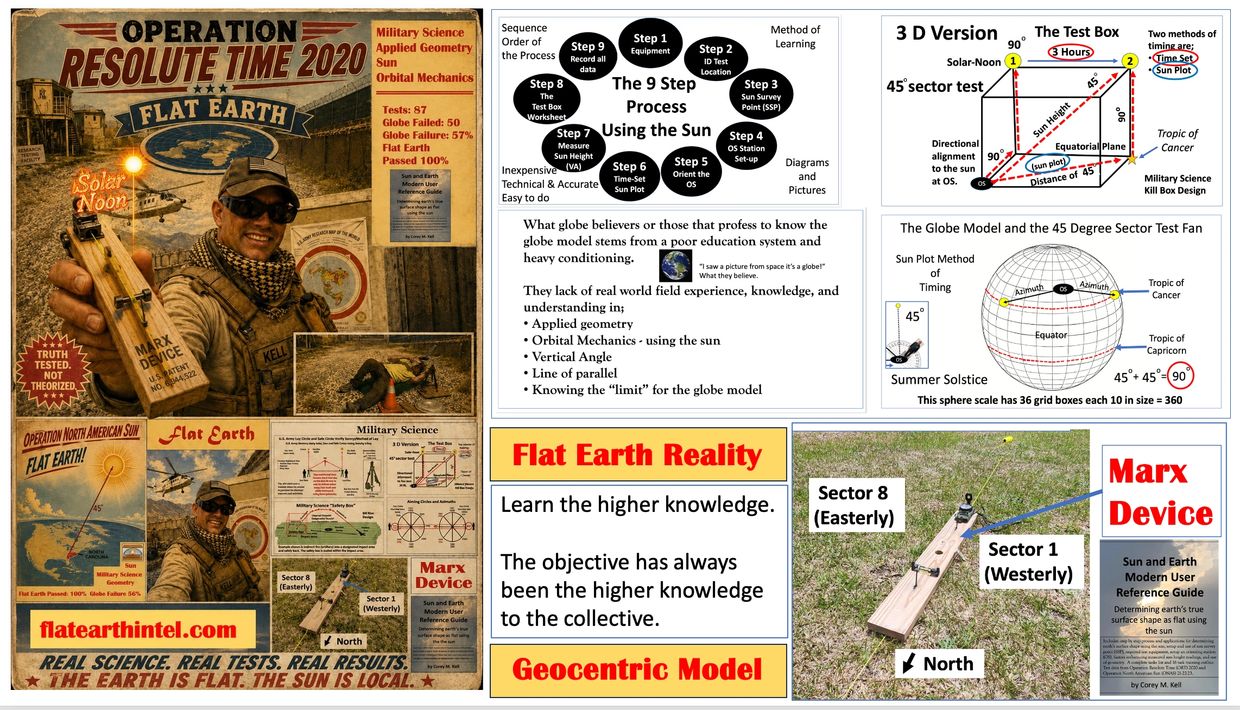
The simple 9-step geometric validation process and application in testing earths shape is now explained in a step by step process developed by military subject matter expert (MSME) Corey Kell. Learning the entire process is designed for self discovery for those questioning the true shape of the earth. And yes its the BIG deal as to the shape of the earth. Meaning if you take the sun for your model you take it all in the cosmology game. The two paths or roads are heliocentric globe model or the geocentric flat earth creation (biblical) model. Through extensive testing we can "exclude" the one model. This means we either were created by higher intelligence a creator as told in the bible, or we were a cosmic accident as told in mainstream science. Corey also explains why models don't mix as some have tried to tie in the globe with the creation model.
From the creation of the process (applied geometry and military science) to extensive testing on both sides of the terrestrial earth it was 7 years in the making. Creating the 45 degree sector test using the sun, geometry and military science to determine earths true surface shape is a foundational work. Testing the models "orbital mechanics" at higher angles (sun height) we can exclude lensing and refraction effects. Extensive testing done by Corey on both sides of the terrestrial earth (over 130) reveal it to be flat in Operation Resolute Time 2020 and Operation North American Sun 21-22-23. The globe model suffered catastrophic geometric failure in extensive tests even at high altitude which should of helped the globe model immensely but failed to. In the 4 of 8 sectors (45 degree) tested the globe model failed all 4 of 8 sectors tested (flat earth model passing all tests). Through this methodology using the geometry of vertical angle and right triangles which are used in civil engineering and military science, we can now cut through the fog and illusion of heliocentrism (globe model). The use and great effect of right triangles are devastating to globe model which remove the vast space long distance game piece off the board. Meaning a very localized (close) sun and moon in the firmament above. It's why the sun only works in one model, the flat earth geocentric model.
Very early on in the verification process of do we live on a globe, orbital mechanics testing should of taken place within science. Tests using the sun because the sun is the center celestial body for the globe model its "the obvious" heavenly body to use. Especially if you have a central heavenly body your said to be orbiting it can become a primary aiming reference especially when its at 90 degrees. Military science methodology makes extensive use of this in aiming references in this manner. Meaning tests checking azimuth (direction) and the height of the sun (vertical angle to it) based on the globes geometric shape (curve). Those tests and validation process should have become standard teaching in our mainstream education system using the sun. This didn't occur, why? Instead we have a sticks in shadows story-line from the past which is a very poor geometric ambiguous process in today's age and technology. The answer is because the vertical angle (height to the sun) is out of position by a great margin for the globe model. You also have to know the limit when testing based on the geometric form or shape your testing and why. This creates huge problems for heliocentric model in general and why the globe is a failed model because they avoid vertical angle testing like the plague. Verifying (testing) the models orbital mechanic's is "the first step".
It's one thing to say the earth is a sphere or flat, its another to actually know how to "test" its true surface shape correctly. Understanding effects of atmosphere, sun season, elevation, and observer (test) location are key factors. Creating a simple yet inexpensive easy to do process and testing was a priority in developmental stages of the entire process yet keeping accountability within the testing. Corey's extensive knowledge within the field of military science facilitated this by creating a layered process and setup. Creation of the MARX device and sun survey point (SSP) were instrumental in this entire setup in accuracy and accountability and in "setting the edge" (start point). Through this understanding in the setup and testing we can now test each models orbital mechanics, globe grid, and FE magnetic alignment grid. Learning manual linear alignment with the sun on magnetic north sets the geometric edge, which is the starting point to take vertical angle measurements to the sun, then it's game on!. This can tell us if we are measuring from a flat or curved surface. I used the sun to test both the globe and flat earth models, and the sun "validated" flat earth.
In creating the 45 degree sector test using the sun, exposed the globe models major geometric shape faults. The field of military science has vastly out paced modern day mainstream heliocentrism in the development of higher technology and equipment which has exposed the globe model as a relic awaiting its time to pass on. Use of the sun as primary aiming reference in hasty survey, this is extensive use of a "flat earth surface" for acquiring location because the sun is 90 degrees and use of triangulation for location. Accuracy of this application is paramount because lives depend on it. Other uses of objects at 90 degrees include; fire control alignment tests (FCATS), weapons bore-sighting, use of primary aiming reference during indirect fire. The revelation of "this truth" is very polarizing and shocking for many. For many, small steps will be required, along with simple understanding of this higher knowledge. Understanding each step in the process opens the door to a whole new world that's been hidden.
In 2019, Corey Kell went to work on designing a test box based on US Field Artillery live fire safety and kill box design. Corey created the 45 degree sector test box, using his extensive knowledge in military science, the sun and geometry. The test box was simplistic yet technical and accurate in the design, and how it would test earths surface shape. The test box would use the sun by measuring the vertical angle or the sun's height at a specific time or designated azimuth (direction) based on the observers location and the suns position in the tropics at a designated distance of 45 degrees for the globe model. This was called a sun plot, and was intentionally left out initially to invite science to come in a sort of trap more or less to find out what mainstream science didn't know. Only time set was used. Time set is a designated time from solar noon to the sun position in the tropics in relation to test site position known as sun survey point (SSP) this sets the geometric edge. In this case 3 hours after and three hours prior to solar noon was used to achieve 45 degrees which is the "limit" for the globe model. The two methods of timing are time set and sun plot. The sun would have to be at 45 degrees or less for the globe model to pass the test box, with the flat earth model having a major advantage in vertical angle because from a flat surface the flat earth could obtain measurements of over 60 degrees or more easily versus the globe have a much shallower limit of 45 degrees because of its curved surface. The other major advantage was Corey's knowledge and use of survey methods in the field of military science where. refraction can be ruled out at these higher angles or angles above 25 degrees. This was done by a method of triangulation from two different survey points using different methods of lay then sighting in on each other called "bumping" (US Army). The USMC artillery units refer to this as a "mag check". Corey would also create a starting point from where to initiate the test the (SSP) based on "manual linear alignment" with the sun. This was accomplished by creating the Marx Device, which when used with a compass would "set" the geometric edge to begin testing from. In all of this he created the 9 step geometric validation process.
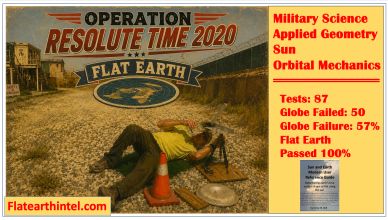
In essence two models would enter the "kill box" and only one model would survive it. Additionally one could check the globe grid and the magnetic variance by doing consecutive day timing and magnetic checks using the compass and Marx device as well as the sun. The stage was set in the Summer of 2020 in the war zone of Kabul Afghanistan on the eastern edge at a place called Pol e Charke. Corey would conduct extensive testing at high altitude which should have given the globe mode a major advantage. Corey called this 6 month period of testing "Operation Resolute Time". This would test two of earths eight 45 degree sectors. Resolute because the processes and applications from the field of military science were definitive and exact, lives depended on it. Time because timing is everything, time equates to distance (distance = surface angle for the globe) when testing both models, time will also seal one models fate, and will give us the answer to the illusive question the shape of the earth. In all there were 87 tests conducted with the globe model failing 50 of the tests and failing "both 45 degree sectors" tested. While the flat earth model passed all tests. Through this extensive testing we can "exclude" one model as a failed model. The standard is 100% pass rate, the model either meets the standard or fails its orbital mechanics.
The test box had served its intended purpose to remove one model as a failed model in extensive testing of its orbital mechanics at high altitude of over 5000'. Next up, testing on the other side of the terrestrial earth in North America in Operation North American Sun 21 22 23. The sun plot method as well as time set would be used to check the globe grid by using GM Angel of 9 degrees, This would tell if the greater declination could save the globe model. The answer was no, in testing the globe model failed 26 of 46 tests, and failing in both 45 degree sectors tested. Test results for both Operation Resolute Time 2020 and Operation North American Sun 21 22 23 are published in October 2023 in the book "Sun and Earth Modern User Reference Guide". God is great, and from all who things come, the creator of heaven and earth.
Updates on the following areas;
Information and requirements; Welcome, the information requirements using the sun. To make it a little more easy, this is about using the sun to determine whether the earths surface shape is flat or curved. And yes it's the "BIG" deal as to creation or cosmic accident. Specifically measuring the suns height (vertical angle) will give us the important information to this sometimes elusive answer, yet very important question. Starting out what we need to know the order of the process. Much of this information is the WHY and HOW this process works. Keep in mind this is a knowledge share with the intent purpose of self discovery process for the individual, take it in small steps :)). It may take a few times of reviewing the information and steps, for some this is the case so don't feel discouraged. After all we weren't taught this in our education system. What we need to know when testing the models (globe and flat earth);
It all starts with the sun, its why validating earths true surface shape using the sun is required. The sun is the center celestial body within the solar system with the earth orbiting around the sun for the globe model. Understanding the 9 step geometric validation process using the sun, military science and geometry is key. Using this validation process and the sun to determine earths true surface shape then becomes most logical and practical choice. This is because the sun (the center celestial body) is at 90 degrees to a person, place, or thing every single day of the year, 24 hours a day within the equatorial plane. The equatorial plane identifies the sun at 90 degrees to earth, it's operating zone for both the globe and flat earth models. This is due to the globe model earth's elliptic orbital tilt which facilitates this act. From that we can measure vertical angle or suns height which will give us the answer to earths surface shape. Both the globe and flat earth models have the sun at 90 degrees. Use and understanding of the sun clock time, lean how to set in a sun survey point using the Marx sun survey positioning device to obtain correct earth to sun manual alignment. Learn the process and application of Solo Timed Observation (STO) and Simultaneous Observation (SIMO). This site is frequently updated. The updated step by step process is in the information page, 9 step by step geometric validation process section.
Sun position when we view the sun in our daytime sky. The winter sun is much lower in our sky in the northern hemisphere and its position is actually what we should see for the summer sun in order for the globe model to work. A low sun in the sky would validate the globe model orbital mechanics. This however is not the case, what we actually see in the sky in the summer with a high sun which is evidence of the flat earth.
I've been asked this question several times; What would of convinced you the earth is a globe? My answer, if during Operation Resolute Time 2020 the vertical angle measurements to the sun would have stayed at about 41-42 degrees or lower at a mile above sea level during the summer sun season and solstice. But this didn't occur, the opposite happened with readings exceeding 51 degrees. This aligns with what globe proof did Corey check; Vertical angle, and it failed by a great margin on both sides of the terrestrial earth.
On the subject of military science some may wonder if military science reveals the earth to be flat wouldn't they just come out and say it? The answer is no, military science supports the civilian government of our time. This is to say that it will not come out and announce "And by the way the earth is flat in case your wondering, next question". Military science recognizes the impact on such a paradigm changing event. Change will come about all in good time. Military science does the *NEXT* best thing it puts heliocentric science in a safe place, in the NON FACTOR Zone. In other words it makes it a "non factor" in any calculations, and is never applied in its science such as firing solutions for weapons systems. Charts and diagrams are shown in some of the manuals but there never applied they are merely window dressing, it's the best and safest thing it can do for now.
The 45-degree sector test was developed from military science celestial survey positioning using the sun and stars, weapons live fire safety and kill boxes.
One of the toughest questions I ask those who believe in the heliocentric globe model; What is the angle of the observer to the object of reference at the time of observation? And whats the limit with regards to the measured vertical angle to this object?
Information requirements;

Completed: Operation Resolute Time 2020 - Kabul Afghanistan from 7 February to 8 August 2020. (81 STO tests performed)
Completed: Operation North American Sun 21-21-23 (47 STO tests from the North American Continent). Began July 25th 2021 to 31 July 23. The last phase of testing long range and hourly testing. Compiled test data results on the information page.
Current: Operations: Operation Pacific Sun 24. Testing the suns speed over the pacific ocean. Operation North Star using the star Polaris (STO Night Testing)
Using Sun Plot Tables and 45 degree sector FAN (easterly and westerly) coverage. (completed)
Videos on; The SSP explained setting the geometric edge and its importance.
Video on; The difference in maps (digital globe and Gleason's flat earth map), declination explained.
Current Operation; Operation Golden Compass sun azimuths, direction and timing 2023 and their application to the Gleason's Flat earth map. Some initial testing has already begun. Testing of sunsets will be included in this operation which started March 30.
Oak Island North Carolina test conducted on 16-17 May 2023.
Why stick and shadows shouldn't be used. The Greek Eratosthenes Experiment and Ambiguity
Why we shouldn't use the Eratosthenes experiment. Ambiguity plain and simple. Example to get the number 4 we can use multiple ways in math, multiplication, addition, subtraction or division to get the number 4. In this experiment a percentage is used as part of the circle. This is a very poor process and example of what NOT to do in testing the earth's surface. It really ends up being more of a math problem than experiment . Red flags all over this one. This is because if you look at the location the suns angle to the stick (and we never do know the actual length of the stick) would have to have been around 82.8 degrees being soo close within the tropic (500 miles) at the time of the alleged test. This means the shadow angle would have to have been around 7.2 degrees (small shadow). Taking this into account doing the math 82.8 + 7.2 = 90 degrees at the stick which means your surface angle is flat. Hence why this is really an incorrect test process. This also assumes the stick was put in at 90 degrees exactly, something else we don't really know. Will give it an E for effort though :)). Measuring the suns angle then applying it based on distance and time as in the 45-degree sector test is what should have occurred, even in today's testing and why the heliocentrist fall back on this in this modern day baffles the mind, but probably cause it works for their model ambiguously.
Is the creator intentionally hiding the shape of the earth, or was it intentionally hidden from us. This one ties in with the tower of babel biblical story.
When we look at the tower of babel story line, God saw what mankind was doing, building the tower to the heaven and made the decision to scramble the language in mankind. Now at first you may think well of course not God would want us to know, or wouldn't he? In other words, God didn't put us down here just so we could go up to heaven, were here for a reason and purpose. Humans don't like confinement, heliocentrism in a way can give the illusion of being not soo confined, but may also allow for further human development, because humans seem to really get sidetracked (obsession) once they figure out; what I'm in a confined area? Which way is out? I know as an instructor, I taught detainee operations to the military in 2005. Escape was priority #1 as a detainee. Perhaps its Gods way of letting this civilization develop in a more complex way, or as a test for us to figure this place out. Civilizations may develop faster or slower based on certain aspects. It's a mixed a bag for sure, something to give more thought to.
In a recent 5 hour conversation via web with a college professor of science what we learned from this conversation and what mainstream science (heliocentric) is missing. And why there are accountability issues with heliocentrism. The meeting was very cordial and he was a very polite and professional host. The professor was provided with a copy of Operation Resolute Time 2020 testing data and 20 pages of information (process and applications) on using the sun prior to the meeting to analyze it. First time I ever heard a college professor say "wow that's a lot" :)).
This is also not to say the Professor is unintelligent, he is indeed an intelligent man. Main stream science has ill prepared them for modern fields of military science. Example if your still using sticks and shadows to prove the earth is a sphere your going to end up in trouble. Why on earth in our modern day would you not just measure sun height? Because this exposes the models weakness if you know how to test it. Again, because they were never taught the correct process and applications (timing, surface angle, position and manual alignment process). And it is why they will struggle (heliocentric science) against modern day military science which is a heavyweight in the field of science.
1. Manual alignment and the sun survey point (SSP). Did not understand the manual alignment process. Information data was given on ORT 2020 and tried to apply wrong location city center, not the actual location to the exact sun survey point. Kabul being approximately 15-20 miles across. Again major error on location and process, which the professor was using the program sun calc. In our review of topics prior to the meeting the professor conceded the sun survey point. Now I didn't tell him at the time but this is check leading into checkmate. If you don't understand positioning with regards to technical measurements such as vertical angle you'll miss the main point. It also identified lack of field experience in this critical area something which is a major problem with heliocentrism. Which basically says the earth is a sphere but doesn't want to account for the surface angle. How ironic.
2. Could not identify the heliocentric models limit for the 45 degree sector test. In other words what measurement (height to sun) exceeds that models limit at distance of 45 degrees. If you don't know your models limit how do you know its valid. Three weeks later he sent me an email acknowledging it is important to know the limit ( I kept pressing this issue with him). Did identify suns size at 1 degree for heliocentric model which is the 45th degree in the 45 degree sector test, and why 46 degrees and above exceeds the globe model limit.
3. Could not identify 45 degree surface distance between sun survey point OS and the suns position in the tropics (using latitude and longitude-this is also surface angle). Would not identify observer angle to the sun based on this distance. *Note* denial isn't a good way to prove your point.
4. Admitted sticks and shadows is an ambiguous test when testing earths true surface shape. He got that one right :)). However still using it as a process in teaching (experiments).
5. Timing, major issues with timing based on location his data given exceeds 45 degree sector in timing or 3 hours. Where is this additional timing coming from? Perhaps a 25 hour clock. The professor lacked field experience, in other words doing actual timing experiments using the sun (manual timing) at an exact position on earth. Where you actually see the suns position change day by day to a designated point on ground, then stay the same on the summer solstice. To actually see this happen is truly amazing.
6. Elevation was another problematic area for the professor, meaning the effects of high elevation on test readings for ORT 2020. The test site was at 5963 feet above sea level meaning measured sun height angles should be MUCH lower because you are higher in elevation to the object or reference the sun. Sun height measurements should have been high 30's to low 40's in degree range at best (instead of over 50 degree) due to the test site high elevation, right at a mile above sea level. Earths true surface shape at sea level is the base.
7. Struggles with applied geometry process and applications, again this is a major weakness of modern (heliocentric) science. This lends into the validity of the models orbital mechanics, if the sun is out of position in the sky (to high in the sky at 45 degree sector) your orbital mechanics will fail. This means the earth is not orbiting the sun, but rather the sun is orbiting the earth. And if your unable to do the simple vertical angle computation (surface angle + measured sun height) using the sun this calls into question both process and application within that field of science and the validity of it "knowing the limit".

With the completion of Operation North American Sun 23 data was reviewed and sun plots reviewed over all data for both major tests and updated.
Operation Resolute Time 2020 totals;
Operation North American Sun 21-22-23 totals;
Test results show major issues with the globe model on both sides of the terrestrial earth especially during the summer solstice period at latitudes of 33 and 34 degrees. Long distance observations also gave us more information on the suns movement and speed over the oceans (faster over Pacific ocean) vs land masses. Flat earth passing all testing at 100%, the standard!

In our life time were *presented* with many different maps of the world in books and media, and what were led to believe we live on. We may never actually really know the *exact* layout of the land and oceans. I have been asked on the subject of maps and creating a new one to which I decline. Mapping is very resource intensive. We can however test the globe model based on its said curve using the sun and measuring the vertical angle to it. The surface shape then can be verified or disproved from multiple locations on earth. Using the sun we can *exclude* the globe model based on its failure in vertical angle tests from both sides of the known terrestrial earth.
Will continue to *monitor* mapping images of earth for *changes* in the future due to major issues with vertical angle for the globe model.
Copernican Model released after Copernicus death
The Copernican (globe model) was released after Nicolaus Copernicus death. I suspect because the globe model failed vertical angle by a great margin. One would not only have to verify azimuths or direction to the sun but also the suns height for any validation of a model in it's orbital mechanics. The equatorial plane and the globes elliptical orbit (position to the sun) is absolute evidence of the sun at 90-degreees as well. Why the sun, its because its the center of the heliocentric solar system, and in that model it is said the earth orbits around the sun, hence the equatorial plane (tropics) and why the sun is 90 degrees to earth in the globe model which tilts to maintain 90 degrees, you can't escape it. This is also the weakest point or the vulnerability of this model. Copernicus couldn't get the vertical angles to work with the sun being to high, and out of position. One would have to verify vertical angles to the main celestial body the sun to confirm an existence of surface angle, especially at the suns maximum zenith during the summer solstice. From testing we can confirm major issues with vertical angle using the sun on both sides of the terrestrial earth. I believe Copernicus knew of the major issue, and hence why he didn't release the model based on his findings and dropped it like a hot rock. This being the vertical angle for the globe model fails by great margin. The sun is just to high in angle or out of position in the sky for the heliocentric model to be valid. And in understanding this, it becomes a very short conversation as to the relevance of the globe model geometrically. The two modern day fields of science that deal most with vertical angle are Civil Engineering and Military Science Combat Arms fields this is because surface angles must be accounted for in their process and applications of their sciences.
The 45-degree sector testing in North American continent, Fayetteville, North Carolina. More geometric failure for the globe model during the summer sun season. With the globe model failing 26 out of 46 tests right at 56% failure.
The smaller sun right at 50-60miles in size for the flat earth model right at 3000 to 4000 miles above the flat earth enclosed model works just fine. Spin not required.
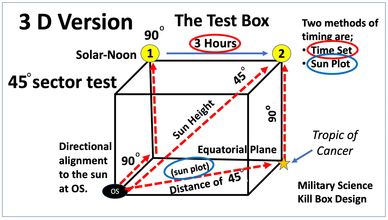
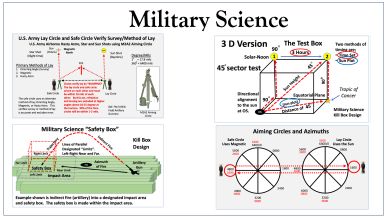
The 3D version of the 45-degree sector test box clearly shows the 45-degree angles both in distance and sun height measurement. Hence why it’s called “the 45-degree sector test” for these reasons. With the heliocentric sun being 1 degree in size it is at the 45th degree or lower at the time of testing. All higher measured angles (+46 or more) exceed the globe model limit. It is the definitive test in determining earth’s surface shape once you fully understand the process and applications of using the sun. Note the sun position1 and 2 and the 3-hour timing between the sun’s positions from the OS. Timing for this action must also be verified by the sun plot azimuth which is the measured azimuth to the suns location. The suns 90 degree position on earth is marked by the star. The star is the spot the sun is 90-dgerees in the tropics. For the globe model distance on the globe also equates to surface angle which must be accounted for. "Distance equates to surface angle to the sun on the globe model".
The origin of the test box developed from military science artillery live fire safety and kill boxes as shown. Real world practical application in use.
The long range test box as shown. This test box is used for longer ranges than 45-degrees which can give us information on just how far out of tolerance the globe model is with regards to vertical angle. Testing distances (surface angles) of 60 degrees or greater at 3 to 4 plus hours time from the OS for the globe model. In tests performed during Operation North American Sun 23 tests exceeded 15-degrees over the limit for the globe model during the summer solstice period. This is right at where I projected the maximum out of tolerance range would be. This also gives evidence during testing that the sun appears to be moving faster over the pacific ocean perhaps to limit the evaporation of water in the oceans. Something will continue to study.

“The 45degree sector” Test Box worksheet as shown. Each segment of the test box is displayed; (1) the observer angle to the sun, (2) the measured sun height from the OS, (3) the sum total which is the limit in the 45-degree sector test which is equal to the suns 90-degree point on earth (star). The star’s location in the equatorial plane can be obtained by performing a sun plot at sun position (2). For the globe model the observer angle is based on distance which equates to curve of the sphere. On the flat earth model this surface angle is 0 degrees and why the flat earth model has a major advantage in vertical angle measurements to the sun. The suns position can be checked by measured azimuths, this also checks timing and the suns speed if it is15-degrees an hour. The best times are during the summer solstice. this is because we know the suns location in the tropics (Tropic of Cancer in the Northern Hemisphere, Tropic of Capricorn in the Southern Hemisphere).
The test box worksheet examples. Shown are two examples of the test box worksheet; the first has observer angle at 45-degrees and measured sun height of 42-degrees with total sum of 87 which passes the test. The second example of the test box worksheet has observer angle of 45-degrees and measured height to the sun of 52-degrees for total sum of 97 which fails the test. Remember 90 is the limit. Which means at 45 degrees you can only achieve a reading of 45 degrees in sun height to be within the globe models tolerance (45 + 45 =90). It is also why the heliocentric sun at 1 degree in size is at the 45 degrees or lower.
Manual alignment at the OS to the sun is paramount in setting up to test and measure earths surface shape using the sun. Note the observer position to the sun is at 90 degrees (side and forward view). The use of the Marx device and a compass achieves this correct linear alignment. Performing this act sets the geometric edge. Once this is accomplished test measurements of both easterly and westerly can then be obtained from the OS.
Defining the limit and why a measured sun height if 45 degrees is the limit for the globe model for the 45 degree sector test. Note the observer angle at 3 hours and the mark at 45 degrees on the protractor as shown. Its why knowing the sun being at 90 degrees is an important part of understanding the entire process, and why 90 degrees is the limit. Using a "sun plot", surface angle for the globe model can be verified.
The globe model earths tilt and the 90 degree position (summer sun season). You will note the no tilt when the sun is at the equator what is called the Equinox. The solstice times are when the earths tilt is at maximum in the northern hemisphere at the Tropic of Cancer and in the southern hemisphere at the Tropic of Capricorn. These can be the best times to test the globe model as the sun is at its exact position as well as maximum position during solstices. Any testing during the opposite solstice (winter) must include an additional tilt away angle. At the winter solstice an additional 23.5 degrees must be calculated in. Example 45 + 23.5 = 68.5 now must be added to a sun height measurement from the OS at winter solstice. The math; 90 - 68.5 =21.5 maximum sun height reading. The maximum sun height reading would be 21.5 degrees from the OS at Winter solstice at sea-level.
.
Timing is a key factor in the entire process, and perhaps one of the most difficult yet easy to understand. Initially the sun plot was left out as part of the timing process as on open door for modern day academics to venture in, or possibly gain an advantage. This would give additional insight on what modern day mainstream science is missing, fails to understand or just ignores. Now some may call this a trap play, but it was useful in understanding mainstream sciences response to the process of using the sun and the 45 degree sector test. This was evident in the 5 hour conversation with a college professor of science. The big five problematic areas for mainstream science were;
1). Line of Magnetic-setting the geometric edge.
2). Identifying the limit for the globe model in the 45 degree sector test.
3). Identifying distance which equates to surface angle on the globe model.
4). Effects of elevation on vertical angle measurements.
5). Manual alignment process at the OS.
Now this is not to say all mainstream science agrees with the globe model, I know they contact me every now and then :)). With the sun plot and understanding azimuths and the suns location in the tropics, it in effect "closes the door" on timing.
Study of the suns speed and tracking the suns timing has shown it to be faster over the Pacific Ocean "Big Blue". Meaning the sun is moving faster than 15-degrees an hour over the largest body of water on earth. This could be due to lessen the effect of evaporation on this large body of water. While yet still creating heat and humidity effect required for earth's ecosystem. While in other areas such as over African land mass the suns speed slows, also near the Island of Taiwan just as the sun starts to move over large east Asian terrestrial land masses. This could be due to heating of the large terrestrial land masses of earth required by the earths main heat source the sun. Creating a "residual" heating effect of earths terrestrial lands required for our survival. This evidence is shown by measured directional azimuths to the sun and its position in the tropics (equatorial plane) from the OS at specific times from solar noon. Giving us better understanding the intelligent design mechanics of earth.
When we look at timing at the OS we are checking for complete orbital rotation whether you believe the earth is moving or the sun. This can be done by observing consecutive day SSP and marking each day at solar noon using the SAME time. There are three options. Note in the diagram above day 1 is the original day. Option 1; If on day 2 the NEW mark is EAST of day one orbital rotation is not complete. Option two; If on day 2 the NEW mark is WEST of day 1 orbital rotation is complete + some additional time. And the last option if both day 1 and day 2 markers are the same orbital rotation is complete.
The timing test on consecutive days using the same time can tell us if orbital rotation is complete as shown by the SSP marker positions on ground. Whether you believe the sun is moving in the flat earth model or the earth is spinning as in the globe model. There are three options as shown in figure 2-3, if the 2nd day SSP is east (1) of the original day then orbital rotation is not complete. If the 2nd day SSP is west (2) of the original day orbital rotation is complete plus some. The last option (3) is exact same SSP as the original day, this tends to occur during the summer solstice period as testing has shown, this also means orbital rotation is complete. Understanding timing is essential part of the entire process yet very simple in its application. It can give us much information about the suns movement in our daytime sky based on our position on the terrestrial earth. Typically, during the summer solstice in the northern hemisphere, the consecutive day SSP’s are exactly the same on both sides of the earth from testing. However, during the winter solstice, a more erratic pattern appears to take place with differences both east and west and farther apart on consecutive days in initial testing. More study will be required on this

When we look at timing we must consider the suns speed or movement in our daytime sky. In checking the 45-degree sectors timing is critical as well as verifying the azimuths easterly and westerly directions. The OS location has input on this as well. Meaning north and south directions farther from the suns operating range in the equatorial plane. Once the line of survey is established at the OS we can then tests the globes 45 degree sectors vertical angles (sun height). Suns drift beyond the 3 hour mark may or may not occur to reach the set azimuth from performing a sun plot. From this difference we can see how the globe model has been expanded and why the difference in the flat earth Gleason's 1892 map and globe. Testing different sectors can give us better understanding with the OS location and suns speed which appears to move faster over the oceans and slower over terrestrial land masses.
Whether on the FE or globe model linear manual alignment remains the same within the 45 degree sectors. The observer will test sector 1 which is the westerly sector, and sector 8 which is the easterly sector.
Once solar noon is set by linear manual alignment the clock is ticking for each sector. With a total of eight 45 degree sectors each sector only having 3 hours for 24 hour solar day. Timing also sets the azimuths (easterly and westerly) what is within the limit and what is out of the limit. From this we can distinguish how much the globe model is out of tolerance in sector as shown in the previous slide. This can also tell us how the Globe model may have been restructured from the Gleason's FE map.
The winter sun differs from the summer sun at the OS as testing has shown. The winter SSP's field seem to be more spread out. This maybe due to the sun going through a calibration of sorts in the southern hemisphere. This can also tell us about the suns health if the sun maintains tight uniform patterns in the survey field. More study will be required on this subject.

The distance difference at the OS survey point in a 24 hour period is the different path the sun takes each 24 hour period from the last one. Or in the heliocentric model this would be the earths orbital rotation (globe model) difference in 24 hours. This is also why there are only 3 hours in each 45 degree sector with the sun returning to the survey point in the 24 hour period. There are some days at the solstice where there is no difference between consecutive survey points at all.

The firmament low sky facilitates or assists in limited viewing or lensing of our sun in the daytime sky. Meaning as the above example if the observer is at position 1 they will first see the sun at azimuth of 70 degrees. This sun however is at an actual 45 degrees from position 1 (must use the Gleason's FE map timing ring). The lensing effect of the firmament low sky creates this visual effect. The difference in azimuths is 25 degrees from position 1. The sun at position 2 is in a solar noon to position 1 but is to far out to be seen at 45 degrees from position 1, The sun is however visible at 70 degrees or a side view. within the firmament from position 1. A video will be made to show exactly how this works. The example diagram above show more or less a flat surface face to the firmament which is layered and maybe several miles thick. This barrier may consist of several elements to include water and a more rigid barrier beyond.
1. Is the SDA used for the globe model? It should have been originally, however magnetic declination was used instead because the globe middle earth had been "stretched" beyond what we actually live on so a correction factor is required to account for this its called magnetic declination. The other main factor being in the south being shrunk down when it was actually the most largest area. This created huge navigational issues when going south this can be found in some of the old ship log journals. As navigation using the glove model was off by over 12 -16 degrees.
2. I don't understand magnetic declination how does it work and why is the map (globe) different? Military Science has an easy way of breaking it down they taught it in basic training long ago. There are three north's, TRUE North, GRID North, and MAGNETIC North. Magnetic north is what YOU actually navigate on by use of compass whether mounted or dismounted navigation. Grid north is actually Globe North or the MAP you use to navigate. When reading and navigating military science uses this simple method; Grid=General in rank, Magnetic=Major in rank. When going from General to Major in rank you subtract the GM angle. When going from Major to General you ADD the GM angle. The GM angle is tied to compass declination. What does this all mean? Simple when your looking at a map your looking at an enlarged area or expanded beyond what your actually on so to do actual navigation or when you use the compass you shrink it down to actual size, subtract the GM angle; (this is why you get easterly and westerly +/- numbers in declination). General to Major is demotion so take away the GM angle, Major to General is promotion so ADD the GM angle. On the CLEVER scale this tops out at 100! Some expert navigators would miss this trying to over think it :)). The SDA is for use with the FE Gleason's Map.
3. Why with a low sky would it limit our visibility of the sun? Visual perspective, (the viewing angle) in other words your location to the sun at distance will effect how you actually see it. The beauty and intelligent design work of the creator within the sky we view both day and night holds many wonders some we may never figure out, the ambiance and beauty of it all, those are the great mysteries of the creation works.
4. On the diagram you show more or less a flat surface face of the sky and the sun about the same width is this accurate? This diagram is to depict how the sun would fit in a low flat surfaced sky, the firmament maybe much much thicker maybe several hundred miles in layered thickness. The FE model sun is about 50 miles in diameter.
5. Would the SDA change daily or by position of the observer? Yes it would.

The "45 Degree Sector Test Box" 3-D version defined. At a distance of 45 degrees in 3 hours the suns height is measured from the OS. Alignment at the OS starts the time from sun position #1. Then at sun position #2 the suns height is measured. Whether you believe your on a sphere or flat surface the models limit will be checked against the result to determine this. In some cases the observer maybe more than 45 degrees in distance from the sun. The observer must be cognizant of their location and the suns location in the tropic on the equatorial plane. The two main test areas are a). sun height (vertical angle), and b). timing.
Alignment at the OS is the first step. The observer must emplace a sun survey point (manual alignment). Sun height or vertical angle of the sun at 3 hours is measured from the OS. Line of parallel or the "limit" occurs at 90 degree. The observer must add the measured suns height plus the observer angle 45 degrees to the sun. Example measured sun height 45 degree plus observer angle 45 degrees (45 + 45 = 90) This reading of 45 degree is within the models limit of line of parallel. The sum total cannot exceed 90 degrees for both models (flat earth and globe). At a measured sun height of 46 degrees or more for the globe model you are no longer on the sun, in other words the suns measured height goes over the top of the sun or exceeds the globe model.
Distance between the sun and OS is obtained from measuring latitude and longitude between the OS and sun in the equatorial plane. This is called a sun plot. Distance in latitude and longitude also denote surface angle for the globe model. This must be accounted for as the observer angle to the sun.
The 45 degree sector test 3D version for the globe model. Of key notes the 45 degree sector is set by the east to west distance of the sun in sector from the line of magnetic at the sun survey point, known as survey control point, (SCP)). The suns operating zone the "Equatorial Plane" as shown. Sun angle measurements are made across the 45 degree sector measuring the suns height or elevation at the Orienting Station (OS) which is along the line of magnetic. A Marx Device is used along with a compass to emplace the survey control point. This creates accountability as well as uses timing within the process and application. The 45 degree sector in green on this diagram is north of the equatorial plane, however this can be more linear, northerly or southerly depending on the location of the OS. For the globe model the observer at 3hrs is oriented already at 45 degree to the sun which only leaves 45 degree of measured height to the sun or line of parallel. This is the globe models limit at the 3 hour mark. Any measured height angles above 45 degree puts the globe model into geometric failure. This is based on the heliocentric models sun size at said distance. This can be checked using a range fan (the measured angle exceeding 45 degree) example 1 degree or 46 degree measured angle height to the sun at distance equals 1,638,664 miles. This exceeds the suns actual size and radius. We must remember we are measuring sun center mass in the line of sight at its height.
Additional diagrams and information regarding the 45 degree sector test. Note the location of the OS along the line of magnetic, this is the observer position, this position maybe anywhere along the line of magnetic as long as the observer is able to see the sun. Understanding the farther north or south the observer is from the equatorial plane or band the lower measured sun angles will be this is because based on distance and the increased angle exceeding 45 degree (globe model). The equatorial plane or belt is the suns primary operating zone at which the sun is 90 degree contact point whether you believe the earth is spinning as in the globe model or orbiting the surface of the flat earth. Exceeding the line of parallel happens when the observer measures 46 degree or more in height to the sun. This is because you have now exceeded the suns *said* size at *said* distance in the heliocentric model. The heliocentric model actually works against itself in the aspect (farther distances) unfortunately for that model. Another key essential understanding of why a survey control point is used it *pins* the observer to that position. Meaning the observers line of sight is always center mass to the object (sun) when measured as they traverse onto the sun to measure its height. At 46 degree or more this pulls the observer off the sun at distance and its size. This is verified using a geometric range fan. Range fans are heavily used in the field of military science gunnery with regards to live fire weapons impact areas. They are geometric diagrams used to determine safe and accurate impact of rounds into a designated impact area, this in the process and application is (accountability).
The flat earth model 45 degree sector flat earth model diagram as shown. It is much more simple because of the flat surface. All measure angles to the sun are effect by observer distance to the sun. The farther we are from the sun the lower sun angle will be, and the closer we are to the sun the higher sun angle will be. It really doesn't get much more simple than that. Other effects will be the observers altitude. Increased altitude will decrease measured sun angle, and lower altitude will increase measured sun angle. The flat earth model has a major advantage in this test this is because it has a greater "range" of measured angle (vertical angle) to the sun. Where the globe model only has 45 degrees at the 3 hour mark, the flat earth model far exceeds this exceeding 80 degree of allowable measure angle to the sun. This is also because the sun in the flat earth model is much smaller in size. Current estimates of the suns size somewhere in the 50-70 mile range. This is still being formulated and studied.
The 90 degree sun position as shown in the diagram for the globe model. When testing/measuring sun height (vertical angle) we must understand the suns position for the globe model and in its respective sun season. In the respective Summer sun seasons and when the sun is at the Equator as shown in the (green sphere) the sun is at 90 degrees (vertical) for the globe model in both hemispheres (the only time). The suns position and earths tilt in its season identifies the maximum measured height angle to the sun for this model at 45 degrees for the 45 degree sector test because the observer is at 45 degree surface angle to the sun at the time of measuring the suns height (vertical angle). The sum must then be calculated which is 45 degree surface angle + 45 degree measured height = 90 degrees (maximum limit). The earth for the globe model must tilt to be in compliance of 90 degree for its respective season. The off axis tile is also identified in this diagram which is more or less the Winter season in respective hemisphere. Because of this "off axis tilt" off 90 degree alignment occurs in the opposite hemisphere (Winter season). To account for this off axis tilt a *correction factor* based on the suns position either north or south of the equator (for tests in winter sun season) will be required, When the sun is at the equator no correction factor will be required.
Understanding "Line of Parallel" the globe models limit. When testing the globe model we must understand its limit with regards to the suns height in the 45 degree sector test. We must also remember that observer line of sight (LOS) is center mass to the sun. The observer measured vertical angle (height) of 45 degrees at 3 hours along with the angle of the observer now sets the combined sum (measured angle + observer angle) at 90 degrees or line of parallel with the sun which is at 90 degrees. You now have two lines in parallel. Any measured angle by the observer exceeding line of parallel +46 degree or more exceeds this models limit when we apply it against the heliocentric model's said sun distance at the suns said size. . This model then goes into geometric failure. We can check this using a right triangle calculation (range fan). See the "Range Fan" data slide in this section. Measuring the suns height will give us the answer.
The "Range Fan" Right Triangle calculation as shown. This range fan data is from Operation Resolute Time 2020. Line of parallel was exceeded by 6.6 degrees. Using the heliocentric models said suns distance at the time of measurement. The heliocentric models sun distance varies from 91 to 94 million miles depending on the sun season. The fans distance for this data result is over 10 million miles. This results in severe geometric failure for the globe model because you are now off observer sun alignment line of sight (LOS) center mass to the sun. Based on the suns said size information. Range fans are heavily used in military science gunnery live weapons ranges for both direct and indirect fire determining range safety impact for different types of munitions/rounds.

The "Tilt" angle correction factor (globe model) applied on the summer/winter solstice days sun angle is measured in their respective hemispheres as shown. This tilt angle away from the 90 degrees (winter sun season) is now applied (accounted for) when measuring vertical angles (sun height) from the OS. The example shown is 23.5 degree or maximum tilt angle. The maximum sun height on this day would be 21.5 degrees as shown in the test box. For each day prior and after this number will change with respective tilt in degree.
1. Why use 3 hours as a set time with regards to the test? This is because both models are broken down in to sectors. This is based on a solar day and using "sun position time" at the emplaced sun survey point. The globe having eight 45 degree sectors as well as the flat earth model giving full 360 degree. This equates to eight 3 hour sectors encompassing the model. This is verified by the survey control point using the sun at the OS. The sectors can then be tested with regards to surface angle based on sun position in the sky at 3hrs. Again we must understand OS location as well. Additionally if the earth is not a perfect sphere this will work against that model as angles become more severe. Currently four sectors out of eight total for the globe model have failed geometrically, two in Southwest Asia and two in the North American Continent.
2. In looking at your diagram wouldn't the OS be more than 45 degrees if located outside the equatorial plain? You are correct, and this would be an additional correction factor, which is still being worked out. However the suns height is soo far off in vertical height for the globe model when physically measured in the summer sun season it is mute point really. This would however affect more northerly or southerly OS positions say like from Canada in the northern hemisphere or New Zealand in the Southern hemisphere, where a correction factor of say 8 to 12 degrees or more maybe required. I don't understand why the 90 degrees is important? It is critically important for various reasons, first with regards in being linear in other words we want to be in alignment with the sun at the OS, meaning straight on alignment out from the OS. A compass is used to create this line along with the Marx Device. We then have correct observer to earth to sun alignment. This sets the geometric edge from where we will make a measurement in height to the sun at 3 hours. This means the measurement is not ambiguous, it creates accountability within the process and application. Think of it more or less as placing a L between you and the sun at the set time both lines are at 90 degrees. Secondly the 90 degree mark is the limit for both models meaning from the OS a measured height reading combined with the observers angle to the sun cannot exceed 90 degrees. Once the sum total (measured height to sun and surface angle) exceed 90 degree (line of parallel) that model goes into "geometric failure." This is also why the *test box* diagram as two numbers in each test box for the appropriate model they are that models limit.
4. Is the sun always 90 degrees in the equatorial plain? Yes its the contact point to the earth as in the globe model as it spins or in the flat earth model as the sun orbits over the surface.
5. What about earths axis tilt does it effect the test? Tilt is actually required to get the sun at 90 degrees "within" the equatorial plane or the *belt* which encompasses the globe model. So, yes its required for that model to actually work for the sun to be at 90 degrees and its maximum height for the globe model. However the sector distance is set by the east to west distance in timing at the OS. The observer then traverses onto the sun at the OS and measures sun angle or elevation across the 45 degree sector at 3 hours. Now the Winter testing "tilt away angle" will require a major correction factor for Winter readings, this is something that will be required to be developed in the future. This could effect Winter test readings by up to 20 degrees or more based on observer location.
6. Timing, what is meant by "sun position time"? This is the suns position to the observer at the OS. For each 24 hour solar day the sun can be marked (emplace survey marker) using a compass and a Marx device. The 24 hour solar day can then be segmented based on sun position for each models size. The sun is truly an amazing celestial body learning how to use it as military science does is a higher knowledge process.
7. Whats the hardest part in understanding the 45 degree sector test? Observer angle, it really throws people off, especially using the globe model. Easiest way to understand this is what I call the "Hand and Arm Pointer Practical Exercise" at home. Take an object your able to hold in your hand this would represent the sun. Hold it straight above your head with arm extended upward 90 degrees. Now with your other hand (as a pointer) elevate it up half way to the object at 45 degrees, this is the observer angle you the observer are now at. Now the last 45 degrees raise your hand to point at the object in your other hand overhead (this is the measured angle) you are now at line of parallel or the limit of the globe model (pointing at the object *sun*). Any measured angle (46 degrees or more) beyond that exceeds that models limit.
8. What do the test results mean or tell us? The information identifies major issues within the heliocentric model. The first being the suns size at said distance. This is identified by the very large distance fan "spread". It also identifies the surface angle is incorrect. So it s a multitude of failures which combine for the large range fan spread in distance. This occurs from the vertical angle measurement (height) to the sun within the test range (45 degree sector). If the heliocentric model where to be close then measurements would have been in the low 40s even into the 30s in degree during Operation Resolute Time 2020. This is because of the distance and effect of high altitude, but this did not occur in fact the opposite where sun angle readings were in the low 50s. If the sun measurements would of remained low even in the summer sun season it would have convinced me that curvature did exist. The range fan for the heliocentric model would then work as it does not exceed line of parallel. However test results showed different in providing more solid evidence of flat earth. We must also remember that each model must past the test not just in specific locations but in all locations, and the testing should be nearest to the surface of the earth for accuracy.
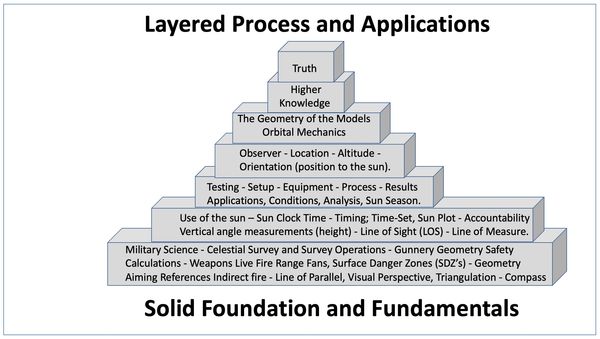
The solid foundational processes and applications in the development within using the sun, military science and geometry are shown in the diagram. Understanding the process and application requires some study, it is a higher developed knowledge. The processes and applications are layered and interlocking within the entire system. It is why the sun, military science and geometry are the foundational base and can be used to determine earths true surface shape. Understanding the 9 step geometric validation process (explained in the information section) encompasses all the foundational work. Do you the individual need to know all this information? Certainly not, it took me the better part of 35 years to understand all of this and 7 years to put this all together, including experiments and testing on both sides of the known terrestrial earth. What you will see on this website are the more simplified applications and processes gained from my experience and using this foundational work to develop the process using the sun. Understanding the use of the sun is the real answer. Welcome to the science of flat earth.

Heliocentrism is in decline as more and more information, testing and experiments are conducted providing solid evidences against "heliocentrism" are brought to light. It is living on borrowed time. despite the billions of dollar's poured into this model to keep it afloat. And when it does collapse, it will come sudden as the wind to ones face in a storm. And if you don't know it yet, there is a storm raging, and there will be those who will go down with that heliocentric ship in the storm. They are the casualties of heliocentrism. Don't be THAT casualty, join us! The flat earth community welcomes you. Share "your experience", help us build a better world and understanding for all. I understand that people can be put in a very difficult situation based on biases, beliefs and ostracized within their field of study or work. Taking that first step can be a daunting barrier. For those that are in this position we have "compassion" for you and understand it takes time. Just know that having the courage to do it, opens up a whole new world for you. We will be waiting for you when you do decide to come into the light :)).

Those mighty men of old, the giants. The grave site soil is said to have healing powers which residents rub on them to be healed from illness. The smaller grave site next to Mir Sayed Ali Agha is believed to be the spouse.

The remnants of the giants are all over the world and this one located in Bagram, Afghanistan.
The subject of giants which has always fascinated me, and originally got me into flat earth. While in Afghanistan I had talked with a few of my interpreters on this subject and the stories abound. Not all Afghans know or believe in giants, typically those in more rural areas of Afghanistan are the ones with stories.

A brief context on on of my favorites simulation theory and how it all "may" work. I'll keep it brief and to the point. This is based on military sciences heavy use of simulation.
Step one; is creation of the soul, you become an eternal being by the creator.
Step two; placement and training; once your created you will be required to go thru series of life experiences, one of these is on a place called earth.
Step three; to go to earth your going to need a suit or a "body" you will be paired with your soul (like pairing a blue-tooth device) for the experiences and yes you'll be required to take care of it or you'll check out early.
Step four; the setup emplacement on earth your going to be exposed to cosmologies, religions, war, sciences, education, biases, and family life. You will have decision points and require to develop critical thinking along the way in exposure to this and many other things while on earth. You may accept, question, develop beliefs or denial in your discovery process and journey. Within this is a complex designed simulation system of organic NPC's they maybe doctors, lawyers, professors, congressmen all designed to support the systems simulation at maximum effect, they may even be a pet animal. These support NPC's have a limited critical thinking ability enough to not seem robotic. Organic meaning they are human like. There will be rules emplaced or guidelines, laws and yes religious as well such as the bible.
Step five; whats MY purpose? that's part of your discovery process in all of this but also, you'll have to LIVE it, and live through it, understand love, conflict, loss of life, the joy of creation, and birth (live love learn). The natural order. You cant just check the block. You can be a part of the system, but you can't run the show, you wont be allowed to. As you may try to significantly alter the simulation to your own need. There are limits as well as benchmarks for you and the civilization.
Step six: evaluation, your going through it daily how you interact, your love, your conflicts, your reaction and understanding of others, the humanities. In this process you may have limited interaction with what are called OC's or observer controllers. OC's are heavily used in the field of military science simulations. These OC's will assess and evaluate you and your reaction to crisis, compassion, conflict, conflict resolution. They maybe a person on a street corner begging for money, or an interview team at a convention, a doctor someone you would have limited interaction with. They are not allowed to identify themselves as part of the simulation. Are you a game changer? They will identify this as well, and the simulation maybe altered.
Step seven; graduation pass or fail in any event your leaving this place one way or the other, you cant stay. Then its on to the next level or perhaps recycle.
1. Why use simulation as a learning tool? One of the most effective ways really, having to go thru this life and experience cosmologies, religions, war, love. It goes to your very core fundamental being. Military science uses it heavily and with great effect.
2. Is heliocentrism a setup for us to work through? I believe so, we have to work through the falsehoods of it, and other things such as biases, peer pressure as well. It separates us from the NPC's within the system. Humans have far greater ability on critical thinking than a programmed non-player character (NPC). Which is how WE maybe able to identify them as such.
3. You mentioned religion and the bible as being part of the setup or guideline are you saying they never really happened? We have to look at it from a creators standpoint, in other words guidelines will be needed in place to assist in the development of a civilization. This is not to say it never happened but is used over and over to develop a civilization. Earth is more like a sandbox with civilizations coming and going, you only get so much time and then you have to move on. Again, God the creator is very efficient. They are designed as a part of the history here. History may only be 500 years old again were "presented" with much information, and we already know there are issues with the carbon dating system. Religionists may have a hard time with this one.
4. What about the pineal gland and how does it play a role in all of this? I call it the God chip. The creators programing use in humans is littered through out the bible such as in the tower of babel use of changing language, Cain and Abel story are just two examples. God or the creator is a master programmer. Also the movement of animals to the ark two by two are another example of this programing in "animals" as well. In other words God can not only read your mind but induce programing in it as well. This would play right into simulation theory. In the bible pineal or (peniel -biblical spelling) means the face of God. Kind of like putting a name on a Pentium processor chip :).
5. You mention NPC's being "organic" or human like, we can't replicate that here, how is it possible? And probably will never achieve it here at our level as much as we think we'd like that. This is a far advanced stage or level of creation of organic nature. Just because "we" cant replicate it doesn't mean it doesn't already exist.
6. What would be one of the most perhaps strangest twists in all of this? Hollywood, and movies would be a prime example. Meaning how many times have we seen truth in movies as sort of a hidden message, an extension of this thru the art of cinematography. Movies can also be used to support a false cosmology. It's an extremely useful and effect tool. Would this include NPC's? Definitely. This is not to say all of Hollywood is, just certain elements of the entertainment industry. Again remember humans can be "part" of the systems in place.
7. What about crime or felonies such as murder, how do you see it resolved in all of this in the BIGGER picture? I believe that's for the creator to decide, I do feel its probably something that may lead to a forfeiture of ones soul. There may also be a so called wash of the soul once you leave this place. Meaning all memory and acts are forgiven and washed from memory going into your next life journey. However we must remember all life is precious.
8. You mention heliocentrism as part of the system emplace, what happens to those who continue to believe in it? Unfortunately, some may succumb to the programing and belief and develop bias. These are the casualties of heliocentrism. This goes with how the simulation is setup and designed to develop critical thinking skills. There will be those that fail unfortunately. I do think for the most part most will see through it eventually. It takes time, it's not a 10 minute conversation. And in the end of the simulation all maybe revealed to us as part of an after action review (AAR) process or lessons learned.
9. What about time how would it work for simulation theory? Our time here very short, limited here. Time in the big picture is irrelevant, meaning this is timeless. There is no specific time frame from when your created to the finish. Haven't you ever heard the saying don't you want to live forever? My answer to them would be how do you know we don't already. Meaning once the soul is created its eternal. The body were placed into is merely like a suit were paired with when we come into this life (liken it to pairing blue-tooth device :)). In the BIG picture there's never been a beginning or ending just an always was. It's the way it's always been done. This maybe a hard concept to understand for some because of the association of books and movies all having beginning and endings for stories. This is on an entirely different level of understanding :)).
10. Do NPC's know they are NPC's? No they believe they are just as human, being organic, it's why the systems so effective and real. However their capacity for rational thinking and cognitive reasoning is limited, their program defines this in them from creation. Example of this would be a NPC being a rocket scientist, ever wonder why he always wanted to be a rocket scientist? Programming.
11. You mention military sciences use of simulation, what are some examples? They use on ground in the field opposing forces for war game simulations as well as air and naval assets. These are called OPFOR or opposing forces. Also within these exercises and training events civilians on the battlefield are used their called COB's as actors in the simulation. Table top exercises are also used in war game simulation. These are just that a table top computer simulation event. There are also situational training exercises (STX's), these are situational based simulation training events. All simulations have whats called a (MEL) Mission Events List. This is time based events for the simulation and interaction of events.
12. Did testing the sun give any information that led you to believe or cement your belief that you are in a simulation? Very much so, sun position. I'll explain, first sun position in testing at high elevation should have been different than lower elevation (same sun season summer at same distance). Example in the summer solstices both test at high and low elevation were nearly same at around 51 degrees. at latitude 34 degrees Geometrically this is impossible. coming from around same latitude location Meaning your viewing the sun as simulation at a certain position there maybe subtle changes in seasons but elevation is key and a dead give away. This maybe a programming error within the simulation or lack of understanding vertical angles and the effect. Or its left as a hint :)). I liken this to the double slit experiment results.
13. Are there dangers knowing your in a simulation? Unfortunately yes, some may choose to exit early (suicide). In other words I don't like the hand I was drawn I'm going to check out early. However I believe firmly that facing these challenges develops your character and defines you in the face of adversity or when things get very difficult. The measure of your character isn't when things are going all peachy keen, but when the road gets more challenging. Facing those challenges "are defining moments" in ones life here.
14. Do you think modern science supports simulation theory? No, although they did the double slit experiment, simulation doesn't fit in with Heliocentricism or evolution. In my conversation with a college professor of science this was also reiterated as I asked him the question on simulation theory. His answer was shocking to me and rather quick as randomness or garbled mush. A predictable answer though *denial*.
15. It took awhile for this one. How does simulation theory work within the context of biblical theology? Probably easier than one thinks and it works extremely well and very precise. It was there all along. The bible mentions judgement day or a day when we will be judged by God for all our acts. Your reliving it right now, you are going thru your judgement day each and every moment, hence why reality is being rendered before your eyes.
~ God is great, all knowing and everlasting and sent his only son Jesus Christ to die for our sins~
16. Have you ever had a personal experience with a simulation even occur that you caught or noticed in real time? Yes, I call it the tale of two hammers. An event where I had a hammer that was lost, show up that wasn't suppose to be. I had purchased another hammer and when the other hammer showed up I held both in my hand and said one of you isn't suppose to be here. So I placed them both together side by side and said will let the simulation catch up and remove the other hammer that wasn't suppose to be there. And sure enough about one hour later when I checked for the other hammer which was right beside the other hammer was now gone, like it never existed.
17. Are there mediums within the simulation? Absolutely. They may communicate with you in the simulation event but cannot disclose they are a medium. They may guide or point you in a certain direction, however YOU must make the choice or decision. It is an extremely clever and effective methodology. These mediums can work through a family member, friend, relative, center of influence, or complete stranger.
18. How is information gathered on you in the simulation? Are there methods of surveillance or data collection? Sure, probably the most effective method and it may seem strange are pets. They can collect huge amounts of relative information on us in our daily lives. They not only live with us but we communicate with them daily.
19. In your recent book "Sun and Earth Modern User Reference Guide" how do you feel it plays into the simulation? I think there's relevance in what is called products we develop and deliver (deliverables) we create within the simulation event that can and will be used in future simulation events and training others in their simulation.
20. Does the information in the book you feel have a changing effect in the current simulation? It may, but it doesn't necessarily have to. Meaning a program update could occur similar to the 100th monkey effect. I call it the sun knowledge update. However it's not required or it may have triggered events within the simulation to occur, without your knowledge. So it could be a mixed bag of things.
21. Are you alone in this simulation or is it multi-person? Difficult to answer, because its a really good simulation, I do think there is an interactive element in it. Meaning mediums can communicate to us in the simulation as a guide or create us to question certain things. Stimulate our curiosity. If its a multi-person simulation it maybe like a graduating class (civilization). Currently, I tend to think its more singular person simulation.